

(Mid-way into writing this article I realized that it was becoming way too long for any sane person to read in one go, so I decided to split it into three parts. This Part 1 out of 3 focuses on the Cost of Acquisition metric, which is broken down into Cost of Marketing & Sales and Cost of Underwriting. The following parts go through the Cost of Servicing, Financing and Expected Losses, and last but not least the Margin.)
Have you heard the term Unit Economics before? It is mentioned so often to entrepreneurs that many hate the term. However, there is a reason why it is mentioned so often. It clearly breaks down your business into measurable sub-parts, shows your performance within each sub-part, and guides you on where to improve. If you perform well on your Unit Economics, you have a solid base to build the rest of your business upon.
Breaking things down into Unit Economics can be done for every type of business, though in this article we will focus on Unit Economics in lending and, more interestingly, how technology can help you improve them.
Breaking lending down into its Unit Economics
In the following section we will break lending down into its Unit Economics. When doing so, we will focus on the average figures, i.e. the economics per unit as the name entails. This can be done in multiple ways, the below version is our way of doing it (if you think we have missed something, send us an email and we are happy to update the post).
We will use three examples, based on approximate figures that we have observed in live examples of lending businesses on different European markets. For each metric, we will give some examples on how tech can help to improve the specific metric.
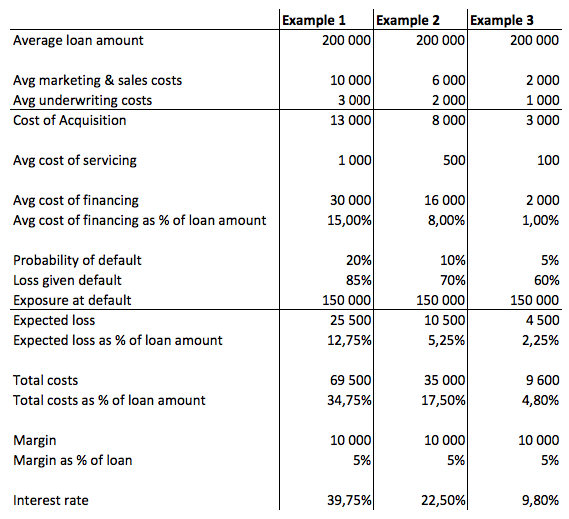
In the above example, we have assumed that each loan runs for a 12 month. As you can see, the metrics differ quite a lot between the three examples. That is not to say that one is better than the other on all metrics necessarily. It can be a strategy to be the high-cost lender that is approving a larger number of clients than what a low-cost lender can do. Below, we dive a bit deeper into these metrics and how tech can help you improve on each one of them.
Average loan amount
There are multiple things that affect what your average loan amount looks like. The total size of your available financing to be lent and your risk appetite affects the maximum size of the loans you underwrite, as it determines the concentration of your portfolio (higher concentration -> larger fluctuations in your portfolio performance). Further, the type of loans (consumer loans, business loans, consumer & merchant credits) you give out, who your target customers are and what the credit risk of those are also comes into play. In other words, your strategy and how it is implemented will affect your average loan.
For the time being, we’ll just assume in each of the examples above that they act on the same market, i.e. that they target a similar group of customers with the same type of loan and that they by some miraculous chance happen to have the same average loan amount.
Cost of acquisition
The cost of acquisition can be broken down into two sub-parts; marketing & sales costs and the cost of underwriting. Both of these are expressed as the average cost per loan.
Average marketing & sales costs
To compute this number you take the total cost of marketing and sales (advertising costs, commission costs to sales personnel, commission costs to affiliate partners,etc.) and divide it by the number of loans you have lent. I.e.

Obviously, the more efficient your marketing and sales are, the lower your average cost of acquisition is going to be. So, how can technology help you to improve on this metric? The answer is two folded:
Conversion rate
Improving your website and making the application process shorter for your client are two common actions that firms take to improve on their conversion rate. When working on the website side of things, one tend to try to improve both the UX and UI of it, so that your page visitors understand your offering better and that the behaviour flow (e.g. after having visited page 1, the user visited page 21, then page 3, and so on) leads them to a part of the page that is getting them to make an application.
A second, often overlooked part, is to improve on the page technical performance, which often has to do with page speed. Optimizing your page speed is easier said than done, but has a large impact on how many of your visitors drop off when browsing your page (i.e. leave it for something else) and also your SEO performance as Google is starting to integrate it into their ranking algorithm.
Making the application process shorter can be done by connecting to credit bureaus APIs, so your customer does not have to fill in all the data you need to do your credit assessment. There is also the option to get access to bank account data by connecting to any of the services that are using the PSD2 directive, which allows you to do a cash flow analysis of your client. Or how about connecting to accounting softwares’ APIs to get access to their latest financial statements and invoices? The list can be made long when it comes to the data that can be accessed in the back-end or in a more user friendly way than what traditional players are offering. In addition to improving your conversion rate, this data can improve on your credit decisions.
From our experience, the conversion rates differ significantly between different lenders. Optimizing your website layout and speed, as well as shortening your loan application flow, can have a major impact on your conversion rate.
Retention rate
A very important metric in any business is the retention rate, i.e. for how long your clients continue to use your products/services. To give an example, according to a study conducted by Bain & Company and commonly cited by Harvard Business Review, improving on your retention rate by 5% can have a 25-95% impact on your profits. Pretty crazy right?
In lending, this translates into how many times your customer comes back to take another loan or how often they refinance their first loan. Selling a new loan to an existing customer tends to be easier and cheaper than selling it to a new customer, as your existing customer already has an established relationship with you as a lender. However, a loan tends to be a low engagement product with a high engagement of the customer in the application and underwriting, and then months, or even years, with low engagement that mainly consist of monthly loan repayments and an occasional customer service call. Working on your retention rate is pretty difficult in other words.
However, there are multiple ways that your retention rate can be improved with tech, some of which are the following:
- Automated email campaigns: not just newsletters, but customized emails with the client’s details depending on how far it has gotten into the loan maturity and also taking into account if it has missed any payments.
- Improving the loan repayment experience: how do your clients prefer to repay your loan? A paper invoice, emailed invoice, emailed invoice with option to pay by credit card, direct debit, or any other payment solution? The payment solution you choose can have an effect on your repayment rate, but can also be setting the stage for how you interact with your client. An invoice can be used as a medium to communicate with your client and as leading it back to your website/application, increasing the chances of upselling.
- Additional value creation: providing your users with additional services such as analytics/budgeting tools/etc. can be a way of increasing the engagement of your clients so that you get upsell opportunities. Or how about going all the way and launching a full shopping app like Klarna did?
As we can see in our three examples, the acquisition cost differs quite a lot between the three of them. Example 1 clearly has the highest sales and marketing costs, whilst example 2 and 3 have managed to lower the cost. This in turn has an effect on the overall cost of acquisition, and in turn, the overall cost base and required pricing to become profitable.
Average underwriting costs
The cost of underwriting a loan includes the costs of acquiring the required data to make a credit assessment, but also the cost of the credit officer making the decision.

The cost of getting the necessary data to make an accurate decision clearly depends on what data services you decide to use (credit bureaus, bank account data services, accounting data APIs etc. to mention a few), the deals you make with the service providers, and the size of your business (most data providers decrease the cost per data-point the larger the volumes you order). The alternatives to buying the data is to ask your customer to provide it (which will affect your conversion rate) or to base your decision on a more narrow set of data points (which might affect the accuracy of your default prediction - more on this in the chapter of Expected Loss).
Another element which is not as often discussed however, is how you make use of the data. Many traditional lending businesses order credit reports in PDF format, which are later on saved in a shared folder. Reusing this data for future assessments or credit model calibration clearly becomes difficult. However, if you set up API integations to access this data, it becomes much easier to save it in a database, which later on can be accessed and reused either when making a second assessment of the same client or when recalibrating your credit models. But also making use of other data elements, like how often your client opens a digital invoice or checks its loan balance. Some studies say that 73% of company data goes unused for analytics. Honestly, I have no idea if that number is correct or not, but I have seen how ineffective many lenders use their data in their operations.
Obviously, the more manual your credit decision process is, the more work hours it requires per assessed loan application and the higher your underwriting costs become. Automating parts of your underwriting processes allows you to decrease the time of manual work spent per loan application, and by that your underwriting costs. This can be done by doing what we discussed above, i.e. getting data through API connections, but also by automating your credit decision processes.
In our example, we can see that the cost of underwriting differs between the three lenders and that it affects the overall cost of acquisition.
Alright, that’s all for today folks. Next, we’ll dive deeper into the Cost of Servicing, Cost of Financing, Expected Loss, and Margin.

